

Activity and analytics
The Activity page shows what your slides did with the AI: how many calls they made, how many failed, how fast the provider answered and what it consumed. Use it after a course launch, to investigate an error, or to follow costs. Owners also find the workspace’s security log here.
To open it, select Activity in the Test & monitor group of the sidebar. The page has three tabs:
| Tab | What it shows | Who sees it |
|---|---|---|
| Overview | Key figures, the daily trend and breakdowns for a period | Everyone, depending on the plan |
| Requests | Each recorded call, with its details | Everyone |
| Security | Sensitive changes made in the workspace | Owners only |
On plans without analytics, there is no Overview tab: the page opens on Requests.
Fair-use limit
Section titled “Fair-use limit”When the workspace has a fair-use limit, Owners and Editors see it on one line under the page title, with a thin bar under it: “N of M learner messages this month · resets date”.
- Each message a learner sends to a published slide counts. Tests in Try it and the Sandbox don’t count.
- The count starts again on the 1st of each month (UTC).
- The (?) hint next to the line explains the limit. It protects your workspace against abuse, normal use stays well below it, and it is never billed.
- If your courses need more, select Contact support at the end of the line to ask SlideMind support to raise it. Once support has raised it, the hint says “SlideMind support raised this limit for your workspace.”
When the limit is reached, the line reads “Learner chats are paused until date, when the count starts again.” Until then, learners see that the AI assistant is temporarily unavailable. See Troubleshooting.
The Overview dashboard also shows a notice when the workspace nears the limit and when learner chats are paused.
Choose a period and filters
Section titled “Choose a period and filters”The Overview and Requests tabs share the same period and filters. All dates follow UTC.
- Period: the menu button shows the selected period and its dates, for example “Last 30 days · Sep 13 – Oct 12”. Choose Today (in progress), Last 30 days, including today (the default), Yesterday, or Last 7 complete days, Last 30 complete days, Last 90 complete days or Last 365 complete days.
- Custom dates…: shows From (UTC) and Through (UTC), for any period from 1 to 365 days.
- Funding mode: All modes, SlideMind credits, Own API key, or Unclassified history for older calls recorded before SlideMind kept the funding mode.
A period that includes today shows “Live · updates every 30 s”: the page refreshes on its own while it is visible. A period that ends before today says so and offers View today. Select Refresh (the circular arrow) to reload at any time.
When you select a course, slide or model in a breakdown (see below), it becomes a filter too, shown on its own line, for example “Slide: Photosynthesis quiz · Clear filter”. Clear filter removes that course, slide or model filter only; the period and the Funding mode stay as they are.
Overview tab
Section titled “Overview tab”Key figures
Section titled “Key figures”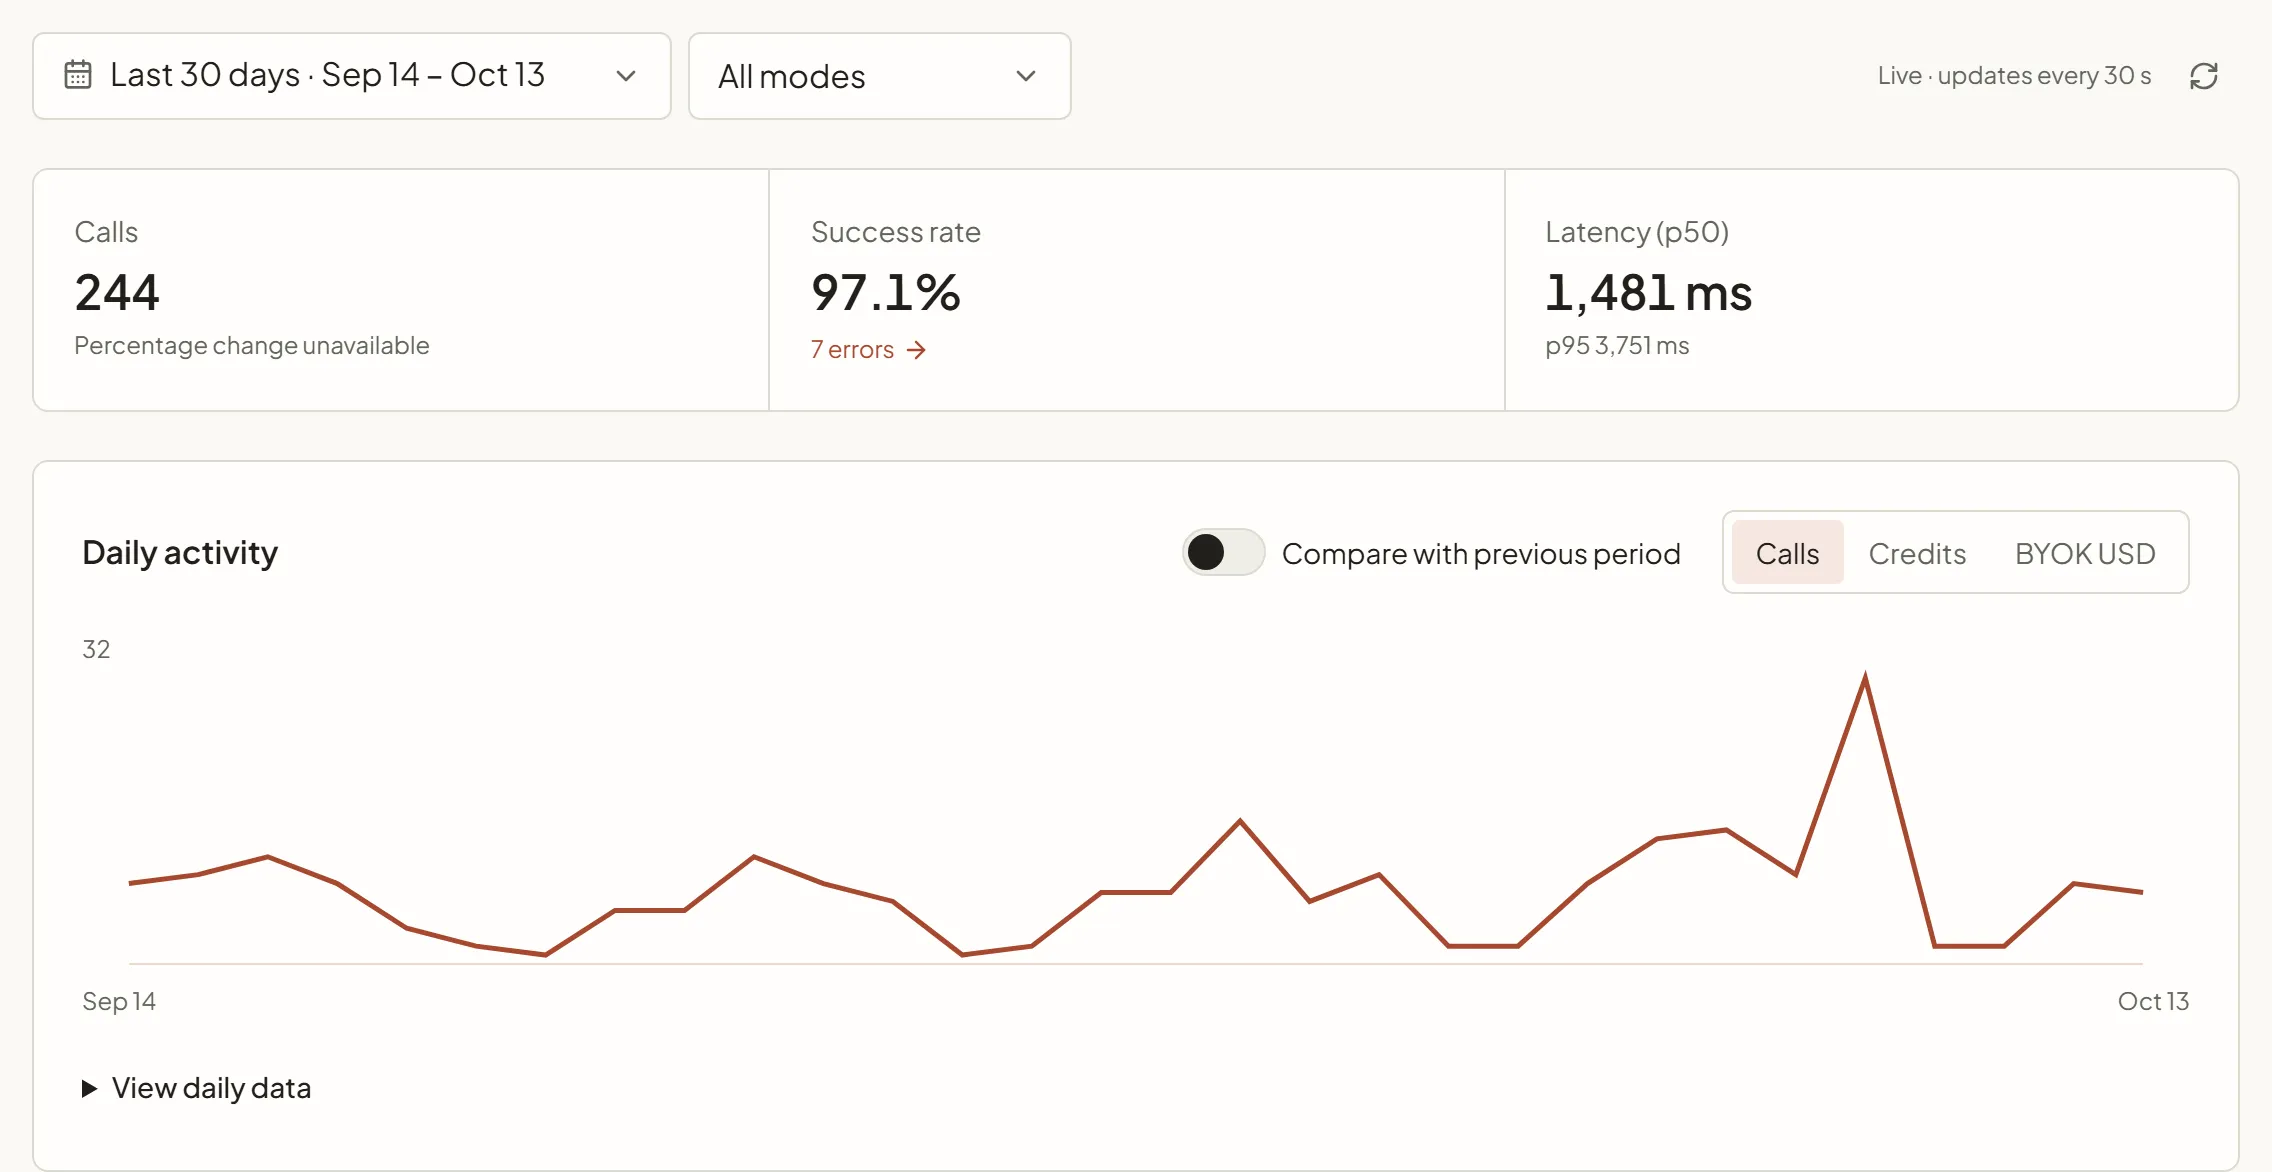
A strip at the top of the tab sums up the period:
| Figure | What it shows |
|---|---|
| Calls | The number of calls in the period, and the change “vs previous equal period” when there is something to compare. |
| Success rate | The share of calls that received a provider response. When some calls failed, select the “N errors” link to list them in Requests. |
| Consumption | SlideMind credits actually debited and, for calls made with your own keys, Estimated provider cost · BYOK in USD. When AI summaries took part, a line shows “of which AI summaries”. Owners and Editors only. |
| Latency (p50) | How long the provider took to answer successful calls: the median (p50), with p95 under it, the time that 95% of calls stayed under. |
The two funding modes use different units and are never added together. When older calls were recorded without their funding mode, a line under the strip says “N older calls have no funding mode recorded and are left out of consumption.” Select View requests to list them.
Daily activity
Section titled “Daily activity”The Daily activity chart shows one value per day, with the highest value of the period on its axis. Choose what it draws with the buttons in the chart’s corner:
- Calls;
- Credits: the SlideMind credits debited;
- BYOK USD: the estimated cost of calls made with your own keys.
Credits and BYOK USD are available to Owners and Editors. Turn on Compare with previous period to add the preceding period of the same length as a dashed line, on the same scale; the dates of both periods appear above the chart. Open View daily data for the exact values.
Breakdowns by course, slide and model
Section titled “Breakdowns by course, slide and model”Three lists rank the Courses, Slides and Models that weigh most in the measure chosen for the chart. Each row shows its value and its share of the filtered total, for example “42 · 18.5%”. The (?) next to each title recalls the rule: the top 20, by the selected measure.
- Select a course to filter the whole Overview on that course.
- Select a slide or a model to list its calls in Requests.
- A slide with failed calls shows an “N errors” link that lists them.
- Deleted or unassigned content groups calls whose slide was deleted or is not attached to a course.
Grouping follows the current course structure: if you move a slide to another course, its past calls follow it.
At the bottom of the tab, How these numbers are counted unfolds the counting rules summed up in What the numbers include.
Requests tab
Section titled “Requests tab”The Requests tab lists recorded calls, newest first, 20 per page. Its title gives the number of matching requests, such as “128 requests”. Two extra filters narrow the list:
- Status: All statuses, Succeeded or Failed;
- Type: All types, Learner requests or AI summaries (the summaries made by exchange memory).
The table has these columns:
| Column | What it shows |
|---|---|
| Time (UTC) | The date and time of the call, such as “Oct 11, 20:11”. |
| Slide | The slide, with its course and model under it. |
| Type | Learner request or AI summary. |
| Funding | SlideMind credits, Own API key or Unclassified history. |
| Status | Failed for a failed call. Successful calls leave it empty. |
Request details
Section titled “Request details”Select a row to open the Request details panel on the side. Its header gives the date and time in UTC. For a failed call, the error message comes first. Then:
| Item | What it shows |
|---|---|
| Slide | The slide’s title, and Open slide to open it in the slide editor. |
| Course | The course the slide belongs to, or No course. |
| Model | The model and its provider. |
| Funding | The funding mode of the call. |
| Type | Learner request or AI summary. |
| Tokens | The tokens sent and received, such as “1,204 sent · 312 received”. |
| Response time | How long the call took, in milliseconds. |
| Estimated provider cost · BYOK | For a call made with your own key, its estimated cost in USD. |
| Config ID | The slide’s identifier in the integration code. Select the copy button next to it to copy it. |
Security tab
Section titled “Security tab”The Security tab is visible to Owners only. It lists sensitive changes made in the workspace, across all dates: the period and filters of the other tabs do not apply. Its title gives the number of events, such as “42 events · UTC”. Each entry shows what happened, who did it (“By” a member, “By a former member”, or Automatic) and when, in the same short UTC format as Requests.
| Area | Examples of entries |
|---|---|
| AI and keys | Provider key saved, Provider key tested, Provider key deleted, Default provider changed, AI mode changed |
| Settings | Workspace settings updated, CORS test mode turned on, CORS test mode turned off |
| Members | Member invited, Member joined, Member role changed, Member removed, Invitation canceled |
| Workspace and content | Workspace renamed, Workspace exported, Content imported, Earlier version restored, Workspace deletion scheduled |
| Reference documents | Reference document added, Reference document text replaced, Reference document deleted, Reference document linked, Reference document unlinked, Reference document limit reached |
| Learner data | Learner values opened, Learner values exported, Learner value edited, Learner value deleted, Learner memory purged, All learner memory purged, Memory limit reached |
Under Learner value edited, Learner value deleted, Learner memory purged and All learner memory purged, a line gives the variable, the scope (or the number of values purged, such as “3 values”) and the reason chosen by the owner. See Learner data.
What the numbers include
Section titled “What the numbers include”Read the figures with these rules in mind. The Overview repeats them under How these numbers are counted.
- Calls are the calls that learners make to your published slides. Tests in Try it and the Sandbox, and prompt generation, are excluded.
- Requests refused before the provider call are not recorded, for example when credits are exhausted, when the fair-use limit is reached, when no valid key is available or when the slide is not published. They appear neither here nor in the dashboard’s error card: if learners report a problem and Activity shows nothing, check the Overview dashboard alerts and Troubleshooting.
- Success means the provider returned a response. It does not mean the learner succeeded or that a structured result was valid.
- AI summaries count in tokens and consumption, but not as calls, successes or latency.
- Credits are the amounts actually debited from the balance. BYOK amounts are estimates based on provider prices when the call was recorded; your provider’s bill is the reference.
- Log retention limits the history. The workspace keeps request logs for the number of days set in Settings › Data & privacy (see Workspace settings). A period that goes back further can have gaps; credit debits are kept separately and stay included.
What each role sees
Section titled “What each role sees”| Role | Fair-use limit | Overview | Requests | Security |
|---|---|---|---|---|
| Owner | Yes | All key figures and measures | Yes | Yes |
| Editor | Yes | All key figures and measures | Yes | No |
| Viewer | No | Calls, Success rate and Latency (p50); the chart shows calls only | Yes | No |
Next steps
Section titled “Next steps”- Overview dashboard: the 30-day summary on the workspace home page.
- SlideMind Credits: follow your balance and buy credits.
- Troubleshooting: fix the errors you find here.
- Learner data: manage the learner values whose access is logged in Security.